

In 2026, global airline capacity is entering a phase defined less by recovery and more by consolidation, as the industry transitions from post-pandemic catch-up growth to steadier, demand-led expansion.
In this article, we cover the largest airlines globally and by region. Note that the airlines are ranked using Available Seat Miles (ASMs), flights, and seats, according to data from CIRIUM.
Top 20 Global Airlines by ASMs
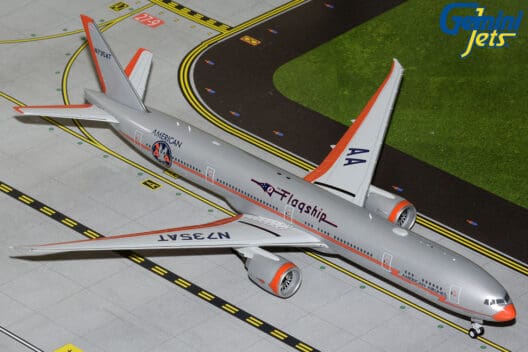
Based on Available Seat Miles (ASMs), United Airlines remains the largest airline in the world in 2026, generating 255.8 billion ASMs. Delta Air Lines ranks second with 241.2 billion ASMs, followed closely by American Airlines with 239.2 billion ASMs.
Among airlines outside the United States, China Southern Airlines ranks fourth globally with 151.6 billion ASMs. Southwest Airlines follows with 136.4 billion ASMs, while Ryanair records 132.1 billion ASMs, highlighting the strong capacity offered by large low-cost carriers.
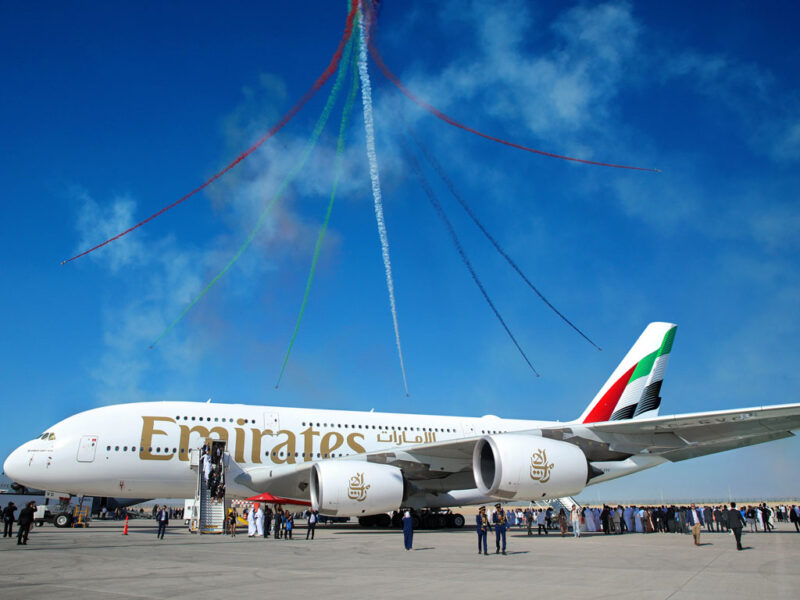
Further down the list, Air China generates 119.6 billion ASMs, while Emirates produces 118.0 billion ASMs despite operating fewer than 100,000 flights due to its long-haul network.
| Rank | Airlines | ASMs |
|---|---|---|
| 1 | United Airlines | 255,839,771,476 |
| 2 | Delta Air Lines | 241,178,804,562 |
| 3 | American Airlines | 239,224,404,349 |
| 4 | China Southern Airlines | 151,647,897,105 |
| 5 | Southwest Airlines | 136,403,295,169 |
| 6 | Ryanair | 132,098,758,446 |
| 7 | Air China | 119,572,338,240 |
| 8 | Emirates | 117,969,628,670 |
| 9 | China Eastern Airlines | 116,252,648,326 |
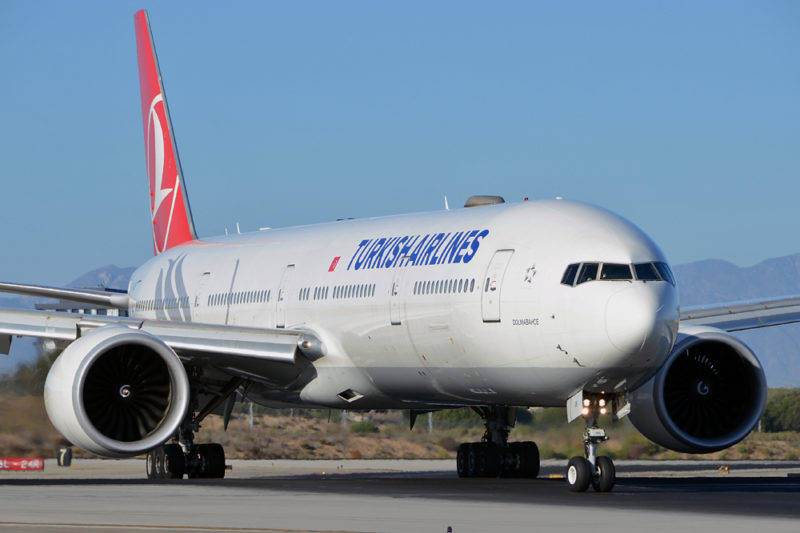
| 10 | Turkish Airlines | 107,780,486,365 |
| 11 | IndiGo | 100,155,849,413 |
| 12 | Alaska Airlines | 86,939,545,524 |
| 13 | Qatar Airways | 84,080,465,579 |
| 14 | Air Canada | 67,421,442,909 |
| 15 | British Airways | 64,476,711,637 |
| 16 | Lufthansa | 64,438,894,018 |
| 17 | Cathay Pacific | 63,383,558,853 |
| 18 | Singapore Airlines | 62,986,238,688 |
| 19 | JetBlue | 59,342,746,161 |
| 20 | Air France | 58,235,552,338 |
Top 20 Global Airlines by Seats
When measured by seats offered, American Airlines leads globally with more than 200.6 million seats in 2026. Delta Air Lines follows with 196.6 million seats, while United Airlines ranks third with 174.3 million seats.
Low-cost carriers feature prominently in this metric due to high aircraft utilization and dense seating configurations. Southwest Airlines provides 171.3 million seats, while Ryanair offers more than 167.4 million seats globally.
Among Asian carriers, China Southern Airlines records 150.2 million seats, followed by IndiGo with 145.2 million seats.
| Rank | Airlines | Seats |
|---|---|---|
| 1 | American Airlines | 200,634,494 |
| 2 | Delta Air Lines | 196,586,627 |
| 3 | United Airlines | 174,347,053 |
| 4 | Southwest Airlines | 171,273,204 |
| 5 | China Southern Airlines | 150,241,001 |
| 6 | Ryanair | 167,418,021 |
| 7 | IndiGo | 145,221,325 |
| 8 | China Eastern Airlines | 124,977,975 |
| 9 | Air China | 111,560,880 |
| 10 | Wizz Air | 83,475,703 |
| 11 | Turkish Airlines | 79,837,206 |
| 12 | SkyWest Airlines | 62,769,907 |
| 13 | Alaska Airlines | 62,264,728 |
| 14 | LATAM Airlines Brasil | 55,964,528 |
| 15 | Lufthansa | 54,793,587 |
| 16 | Hainan Airlines | 54,021,874 |
| 17 | EasyJet | 52,605,615 |
| 18 | Sichuan Airlines | 48,413,550 |
| 19 | Xiamen Airlines | 47,292,436 |
| 20 | Gol | 46,840,358 |
Top 20 Global Airlines by Flights
In terms of total flights operated, Delta Air Lines leads globally with 1,174,865 flights in 2026. American Airlines follows closely with 1,172,147 flights, while Southwest Airlines ranks third with more than 1.06 million flights.
United Airlines records over 1.01 million flights, while regional operator SkyWest Airlines ranks fifth globally with 939,199 flights.
Among non-US carriers, Ryanair operates 872,699 flights, followed by China Southern Airlines, IndiGo, and China Eastern Airlines.
| Rank | Airlines | Flights |
|---|---|---|
| 1 | Delta Air Lines | 1,174,865 |
| 2 | American Airlines | 1,172,147 |
| 3 | Southwest Airlines | 1,067,078 |
| 4 | United Airlines | 1,018,031 |
| 5 | SkyWest Airlines | 939,199 |
| 6 | Ryanair | 872,699 |
| 7 | China Southern Airlines | 849,232 |
| 8 | IndiGo | 785,299 |
| 9 | China Eastern Airlines | 757,425 |
| 10 | Air China | 605,133 |
| 11 | Turkish Airlines | 412,509 |
| 12 | Republic Airline | 397,040 |
| 13 | Alaska Airlines | 370,331 |
| 14 | Wizz Air | 360,544 |
| 15 | Envoy Air | 359,358 |
| 16 | LATAM Airlines Brasil | 305,153 |
| 17 | Hainan Airlines | 300,096 |
| 18 | JetBlue | 294,387 |
| 19 | Lufthansa | 290,887 |
| 20 | EasyJet | 290,148 |
Top 10 Airlines in North America
North America remains the largest aviation market globally by ASM concentration. United, Delta, and American collectively exceed 736 billion ASMs.
Southwest Airlines ranks fourth regionally with 136.4 billion ASMs and 171.3 million seats. Alaska Airlines follows with 86.9 billion ASMs.
Air Canada leads the Canadian market at 67.4 billion ASMs, while JetBlue records 59.3 billion ASMs.
| Rank | Airlines | ASMs | Flights | Seats |
|---|---|---|---|---|
| 1 | United Airlines | 255,839,771,476 | 1,018,031 | 174,347,053 |
| 2 | Delta Air Lines | 241,178,804,562 | 1,174,865 | 196,586,627 |
| 3 | American Airlines | 239,224,404,349 | 1,172,147 | 200,634,494 |
| 4 | Southwest Airlines | 136,403,295,169 | 1,067,078 | 171,273,204 |
| 5 | Alaska Airlines | 86,939,545,524 | 370,331 | 62,264,728 |
| 6 | Air Canada | 67,421,442,909 | 188,196 | 34,833,988 |
| 7 | JetBlue | 59,342,746,161 | 294,387 | 46,693,209 |
| 8 | Volaris | 35,155,045,779 | 191,286 | 38,155,493 |
| 9 | Frontier Airlines | 30,816,415,362 | 160,179 | 33,944,046 |
| 10 | WestJet | 30,762,782,822 | 137,629 | 22,592,832 |
Top 10 Airlines in Europe
Ryanair leads Europe in 2026 with 132 billion ASMs, ahead of Turkish Airlines at 107.8 billion ASMs and over 872,000 flights.
British Airways (64.5 billion ASMs), Lufthansa (64.4 billion ASMs), and Air France (58.2 billion ASMs) maintain similar capacity levels, reflecting the competitive balance among Europe’s major network carriers.
Low-cost operators continue to account for substantial capacity. Wizz Air generates 73.4 billion ASMs, while EasyJet generates 46.3 billion ASMs.
| Rank | Airlines | ASMs | Flights | Seats |
|---|---|---|---|---|
| 1 | Ryanair | 132,098,758,446 | 872,699 | 167,418,021 |
| 2 | Turkish Airlines | 107,780,486,365 | 412,509 | 79,837,206 |
| 3 | Wizz Air | 73,420,525,914 | 360,544 | 83,475,703 |
| 4 | British Airways | 64,476,711,637 | 215,839 | 41,722,607 |
| 5 | Lufthansa | 64,438,894,018 | 290,887 | 54,793,587 |
| 6 | Air France | 58,235,552,338 | 182,384 | 33,012,903 |
| 7 | EasyJet | 46,300,255,923 | 290,148 | 52,605,615 |
| 8 | KLM | 40,175,923,578 | 118,334 | 25,020,643 |
| 9 | Jet2 | 36,890,636,017 | 128,287 | 25,609,431 |
| 10 | Aeroflot | 32,929,957,879 | 130,145 | 23,066,364 |

Top 10 Airlines in Asia-Pacific
China Southern Airlines leads the region with 151.6 billion ASMs, followed by Air China (119.6 billion) and China Eastern (116.3 billion).
IndiGo ranks fourth regionally at 100.2 billion ASMs and operates 785,299 flights, one of the highest totals outside North America.
Further down the ranking are Cathay Pacific (63.4 billion ASMs) and Singapore Airlines (63.0 billion), among others.
| Rank | Airlines | ASMs | Flights | Seats |
|---|---|---|---|---|
| 1 | China Southern Airlines | 151,647,897,105 | 849,232 | 150,241,001 |
| 2 | Air China | 119,572,338,240 | 605,133 | 111,560,880 |
| 3 | China Eastern Airlines | 116,252,648,326 | 757,425 | 124,977,975 |
| 4 | IndiGo | 100,155,849,413 | 785,299 | 145,221,325 |
| 5 | Cathay Pacific | 63,383,558,853 | 112,489 | 33,685,617 |
| 6 | Singapore Airlines | 62,986,238,688 | 105,448 | 27,758,965 |
| 7 | Hainan Airlines | 54,513,275,570 | 300,096 | 54,021,874 |
| 8 | Air India | 47,341,705,582 | 241,071 | 42,177,506 |
| 9 | Sichuan Airlines | 46,921,501,300 | 285,250 | 48,413,550 |
| 10 | ANA | 45,152,497,675 | 165,038 | 43,600,306 |
Top 10 Airlines in the Middle East
Emirates leads the Middle East with 118.0 billion ASMs. Qatar Airways follows with 84.1 billion ASMs, operating 122,933 flights.
Etihad Airways ranks third at 41.4 billion ASMs, ahead of Saudia (38.2 billion).
| Rank | Airlines | ASMs | Flights | Seats |
|---|---|---|---|---|
| 1 | Emirates | 117,969,628,670 | 99,729 | 39,329,489 |
| 2 | Qatar Airways | 84,080,465,579 | 122,933 | 32,432,083 |
| 3 | Etihad Airways | 41,351,248,794 | 72,642 | 16,481,110 |
| 4 | Saudia | 38,202,908,862 | 170,073 | 34,497,840 |
| 5 | Flydubai | 18,934,014,908 | 92,161 | 15,792,823 |
| 6 | Air Arabia | 14,532,251,923 | 63,017 | 11,228,286 |
| 7 | Flynas | 9,943,258,771 | 80,744 | 13,768,171 |
| 8 | El Al | 9,566,977,443 | 18,453 | 3,681,298 |
| 9 | Oman Air | 8,997,984,619 | 29,557 | 6,113,634 |
| 10 | Kuwait Airways | 8,105,260,176 | 23,584 | 4,845,582 |
Top 10 Airlines in South America
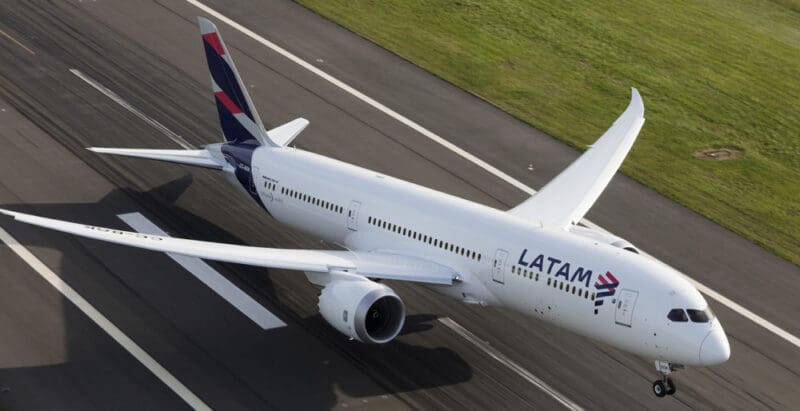
LATAM Airlines remains Latin America’s largest airline group. LATAM Airlines Brasil leads the region with 50.7 billion ASMs and 55.9 million seats.
It is followed by Gol (33.1 billion ASMs) and Azul (27.7 billion ASMs).
Avianca records 24.4 billion ASMs, while LATAM Airlines, LATAM Airlines Peru, and Aerolineas Argentinas rank higher in terms of regional capacity.
| Rank | Airlines | ASMs | Flights | Seats |
|---|---|---|---|---|
| 1 | LATAM Airlines Brasil | 50,659,839,934 | 305,153 | 55,964,528 |
| 2 | Gol | 33,100,315,029 | 259,958 | 46,840,358 |
| 3 | Azul | 27,692,213,930 | 278,788 | 38,976,594 |
| 4 | Avianca | 24,385,462,980 | 171,588 | 31,193,794 |
| 5 | LATAM Airlines | 17,895,884,913 | 70,319 | 14,416,213 |
| 6 | LATAM Airlines Peru | 15,045,165,061 | 103,324 | 17,210,944 |
| 7 | Aerolineas Argentinas | 14,415,595,120 | 107,879 | 15,317,068 |
| 8 | Copa Airlines | 9,091,623,390 | 33,858 | 5,476,630 |
| 9 | Flybondi | 5,589,728,487 | 37,205 | 7,031,745 |
| 10 | LATAM Airlines Colombia | 5,195,105,842 | 73,781 | 12,908,288 |
Top 10 Airlines in Africa
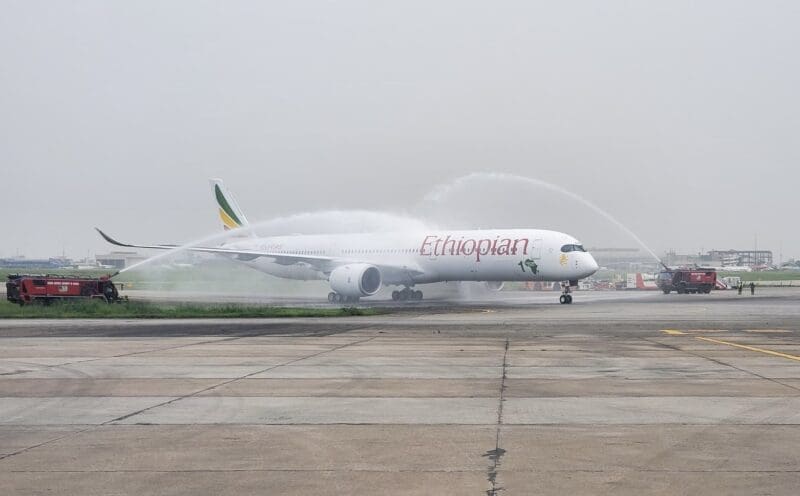
Ethiopian Airlines remains Africa’s largest carrier with 38.5 billion ASMs and 23.5 million seats across 138,815 flights.
It is followed by EgyptAir (14.6 billion ASMs) and Royal Air Maroc (13.1 billion ASMs).
| Rank | Airlines | ASMs | Flights | Seats |
|---|---|---|---|---|
| 1 | Ethiopian Airlines | 38,507,864,865 | 138,815 | 23,511,726 |
| 2 | EgyptAir | 14,586,540,871 | 58,900 | 10,319,410 |
| 3 | Royal Air Maroc | 13,090,313,931 | 50,832 | 8,464,161 |
| 4 | Air Algerie | 7,912,793,827 | 70,100 | 8,539,076 |
| 5 | Safair | 7,398,320,748 | 67,135 | 12,595,827 |
| 6 | Kenya Airways | 5,968,926,514 | 35,008 | 4,567,807 |
| 7 | Air Cairo | 4,289,346,532 | 27,055 | 3,816,472 |
| 8 | South African Airways | 3,963,103,701 | 26,121 | 4,320,955 |
| 9 | Airlink | 3,831,880,396 | 88,176 | 6,535,098 |
| 10 | Air Mauritius | 2,753,535,592 | 11,098 | 1,632,438 |
Source: CIRIUM Diio


Thank you Sam 🙂