


I have been planespotting for over 20 years, during this time technology has evolved greatly to make the planespotter’s life much easier. One big introduction was the flight tracking app.
I remember back in the day plane spotting relied on a combination of insider information, radio scanners, extensive waiting time at the airport and of course some luck. You wouldn’t know much more than what was arriving at a specific time or at a precise location.
I recently visited AirNav Systems, a leading flight tracking company that develops Radarbox, which displays aircraft & flight information in real-time on a map. Andre Brandao, CEO of AirNav, explained the entire flight tracking process, from the airplane sending signals to the receiver to the server and then to the final display on the Radarbox website/app.
You can see the entertaining video here:
How Many Flights are Tracked in the Sky Right Now?
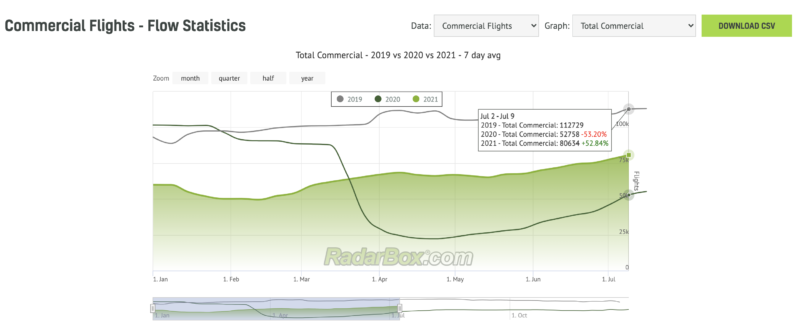
According to Radarbox flight statistics page, currently, 80,000 flights are flying in the sky per day.
This is a big improvement over 52,000 12 months ago, but still below the 110,000 we were recording in 2019.
Unique Data from Radarbox
I’ve found several features that can add a lot of value for aviation enthusiasts and professionals. There is certainly a lot of data available from all aspects of flight tracking flight, however you can also do the following with Radarbox:
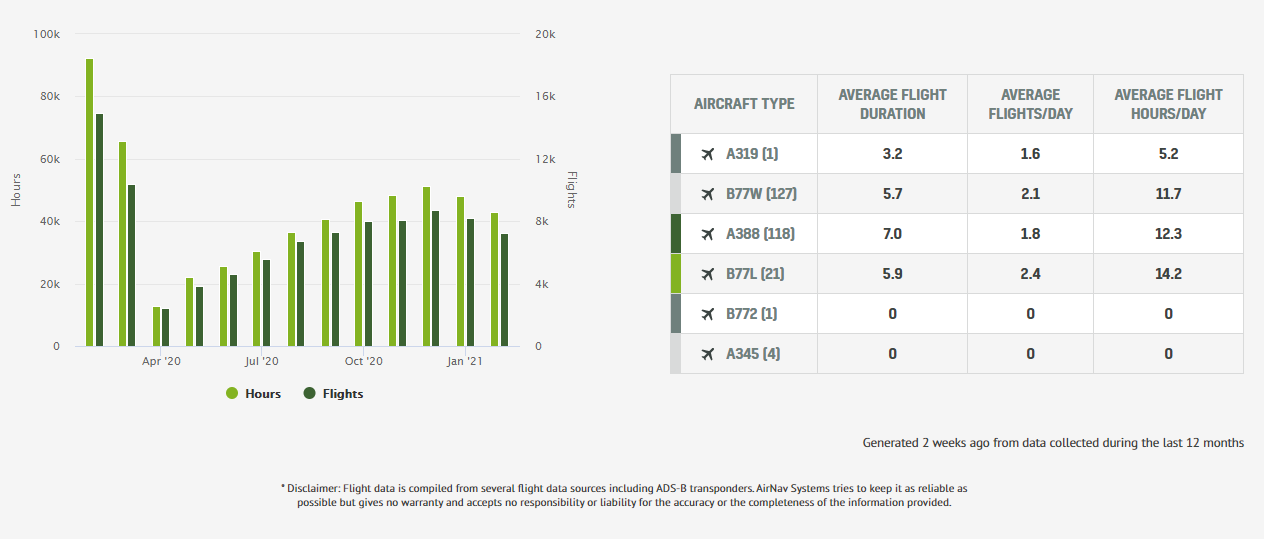
- Find out airline fleet utilization, say how many hours on average an Emirates A380 flies
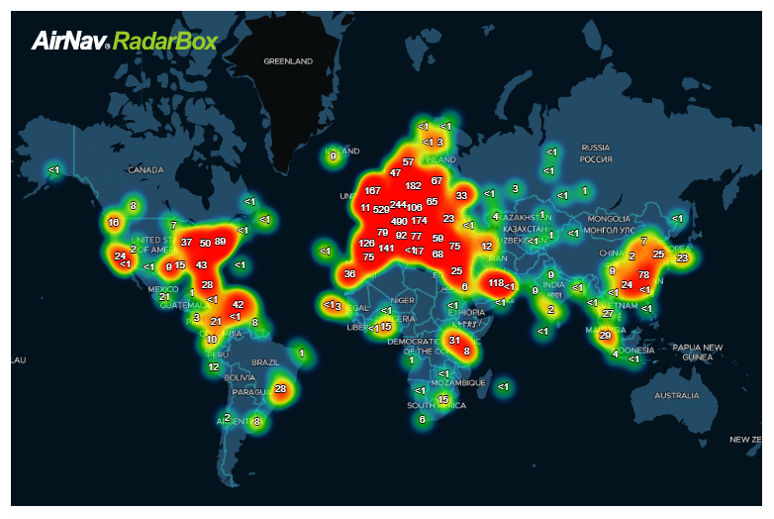
- Find out what’s the number 1 destination from an airport, say London, from the airport destination heat map
- Find out air traffic flow statistics, say from US to Europe traffic per day
- Listen to VHF Air band radio while tracking flight on your screen
- Enhanced display with Routes, SkyVector Map & NavAids
- Advanced weather layer display during flight tracking
- Track not only one plane, track a fleet of your choosing
Aircraft Utilization Statistics & Airport Heat Maps
Below is Emirates airline fleet usage and utilization according to Radarbox. Users can also view figures with various metrics, such as the average flight duration or the total distance flown for the past 12 months and the monthly average. You can track most airline fleets here.
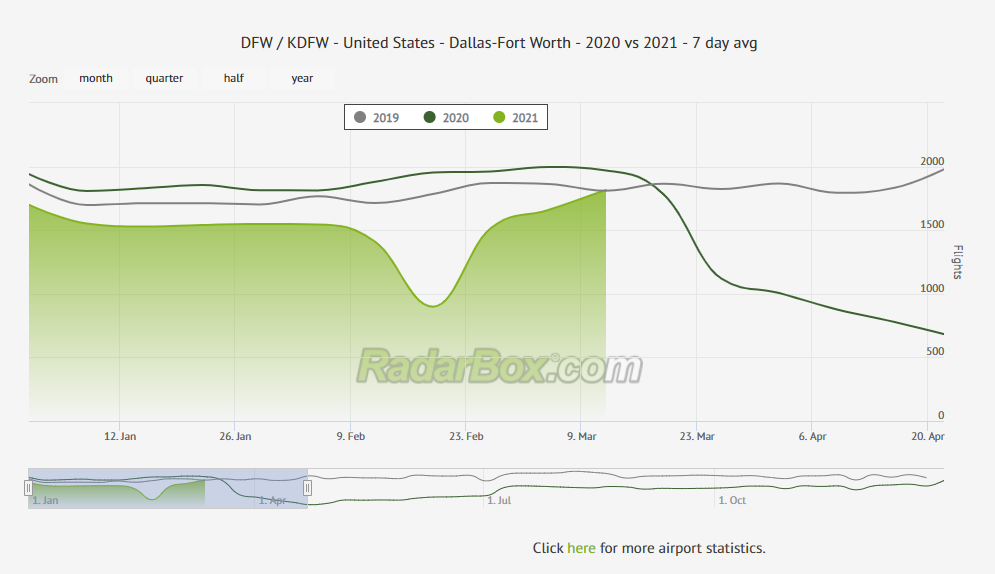
Get movement statistics on the total aircraft traffic (arrivals & departures) at a particular airport.
Airport Heat Maps convert the dry and drab route statistics into informative visualizations. Essentially, the route heat maps display the frequency of flights to different airports or cities from a particular originating airport. Destination airports, where the frequency of flights is higher, are shown in red or orange.
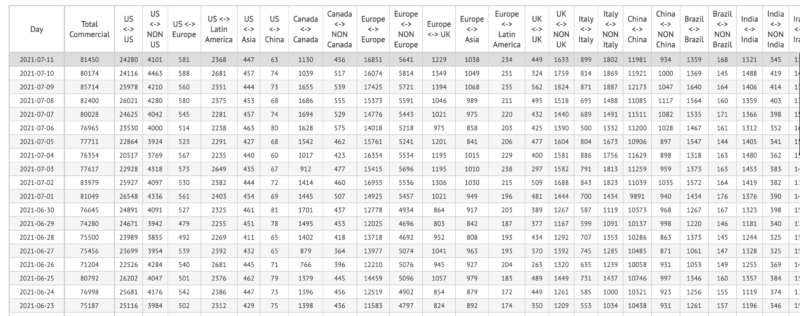
Air Traffic Flow Statistics
You can find out how many flights have been tracked on any given day, say in the US domestically or across regions like from US to Europe.
The real-time statistics page contains a large volume of flight data from flights tracked daily by AirNav Radarbox. This data can be filtered by Commercial Airlines, Business Jets, Commercial Airports, Business Operators or by Route and can even be downloaded in CSV format; best of all it is free for non-commercial use.
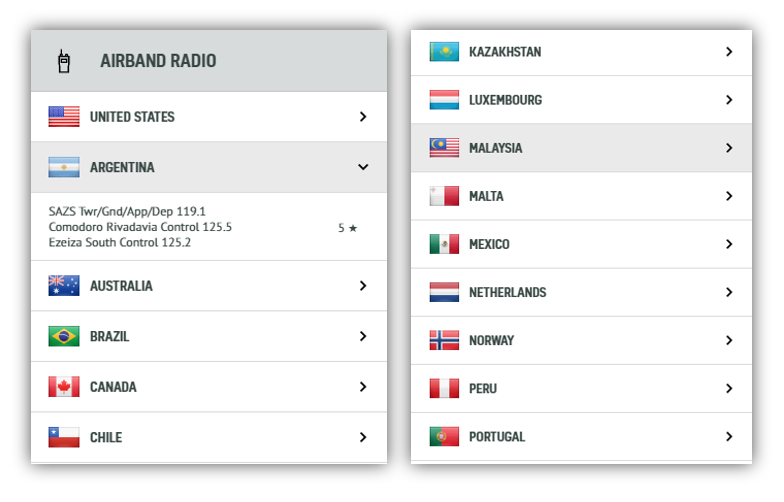
VHF AirBand Audio
Radarbox currently features 21 countries and 40+ airports, where users can listen in on the chatter right from the website or app.
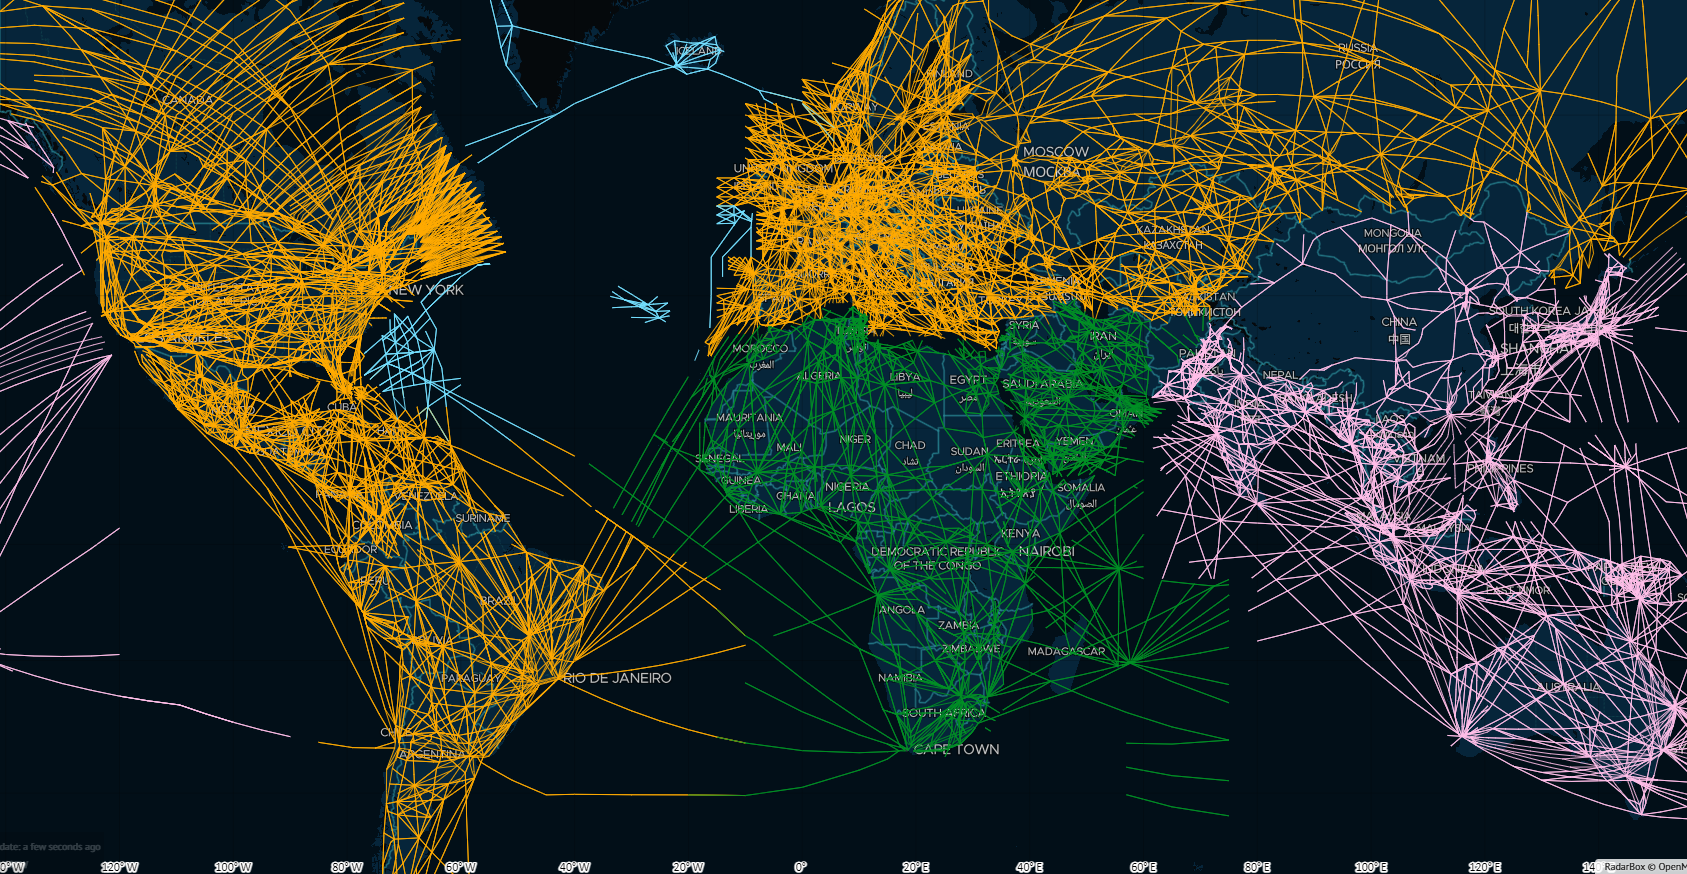
Routes, SkyVector Map & NavAids
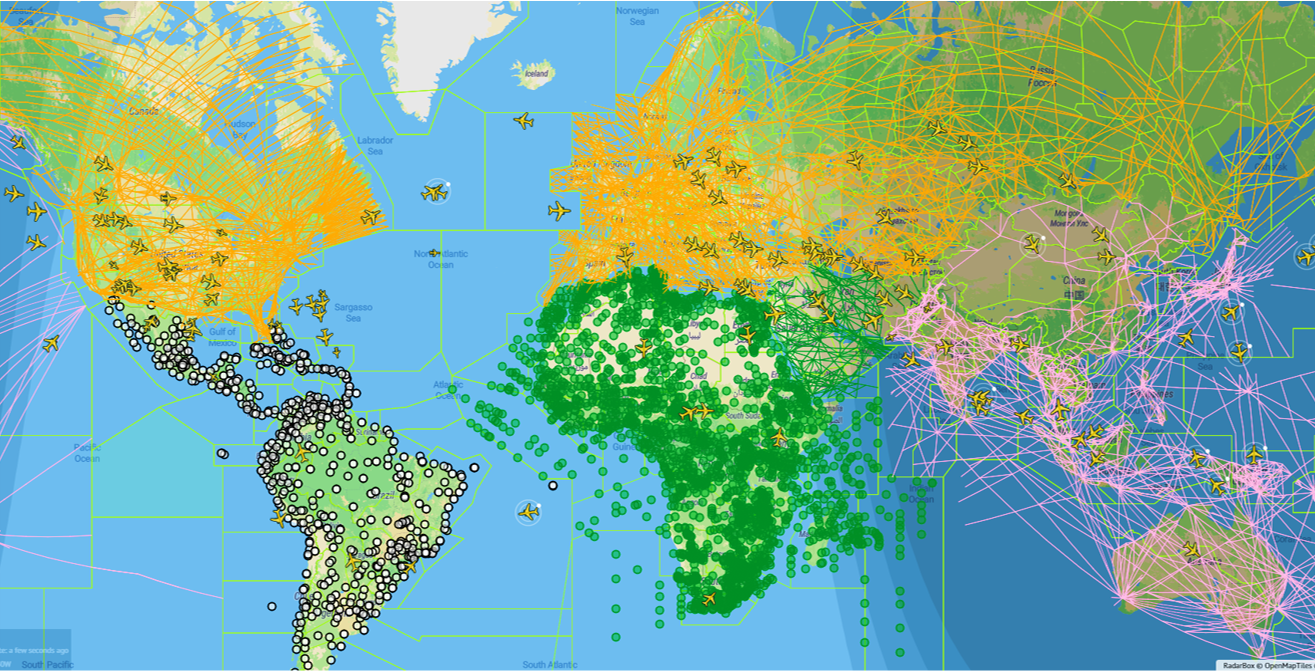
Routes – These “highways in the sky” show the various fixed tracks & routes that flights fly on. Each geographic area has its own color-coded routes for clear distinctions between continents.
Sky Vector VFR – The sky vector aeronautical chart is an excellent navigational reference for pilots and crew to use during flight planning and operations.
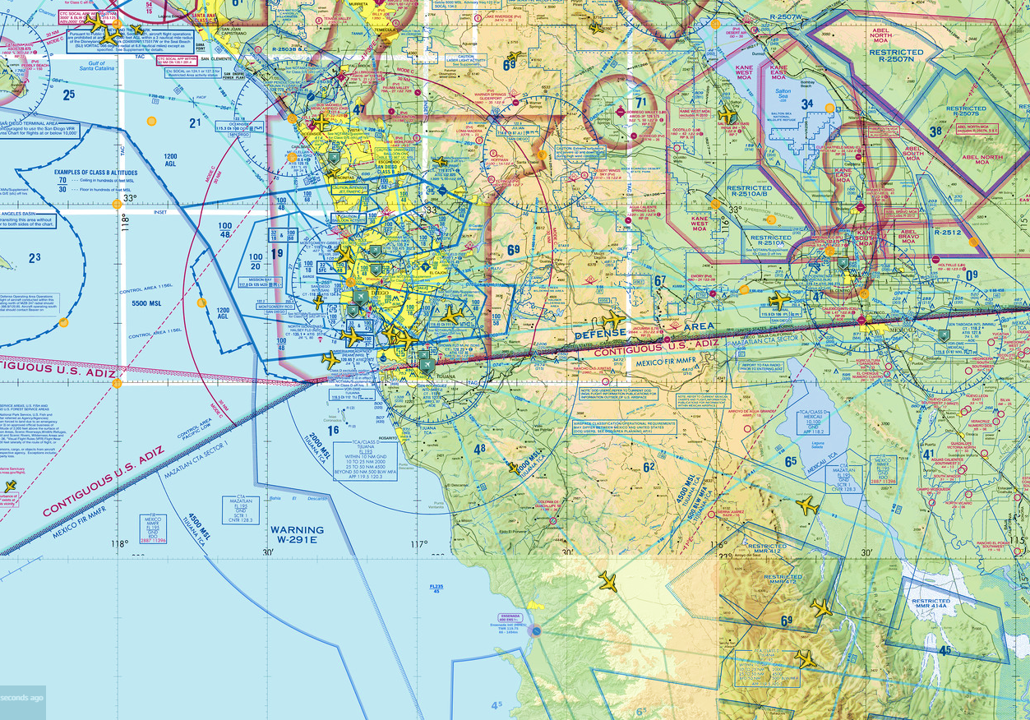
NAVAIDS – This feature displays navigational aids, which are essentially radio beacons that help pilots navigate while flying. Users can turn them on for specific geographic areas to see where navaid are present.
Waypoints – Waypoints are represented as small pink circles on the Radarbox map and just like NavAids you can turn them on for specific geographic areas. Radarbox currently displays NavAids & Waypoints over Europe, Asia, Africa, the Middle East, North & South America and over the Pacific & Atlantic oceans.
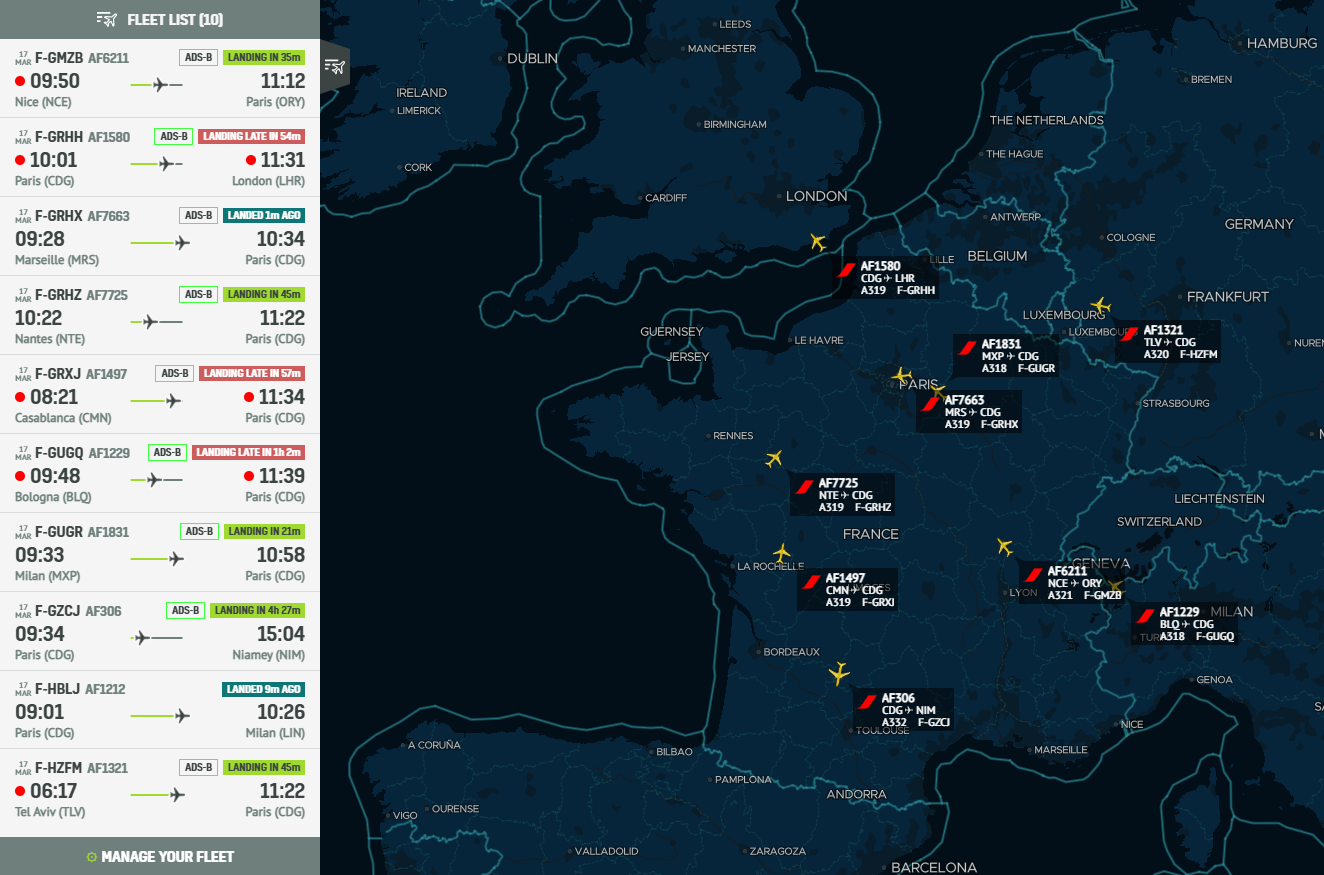
Track Not Just One Plane, but a Whole Fleet!
AirNav’s Fleet Tracker is an all-in-one solution, designed for fleet managers & owners to monitor and better manage their fleet of aircraft. In addition to viewing all active flights and their status, fleet managers can also view flight history for up to 365 days. Advanced aircraft statistics for a fleet, such as total flight hours and average flight duration etc, can also be accessed.
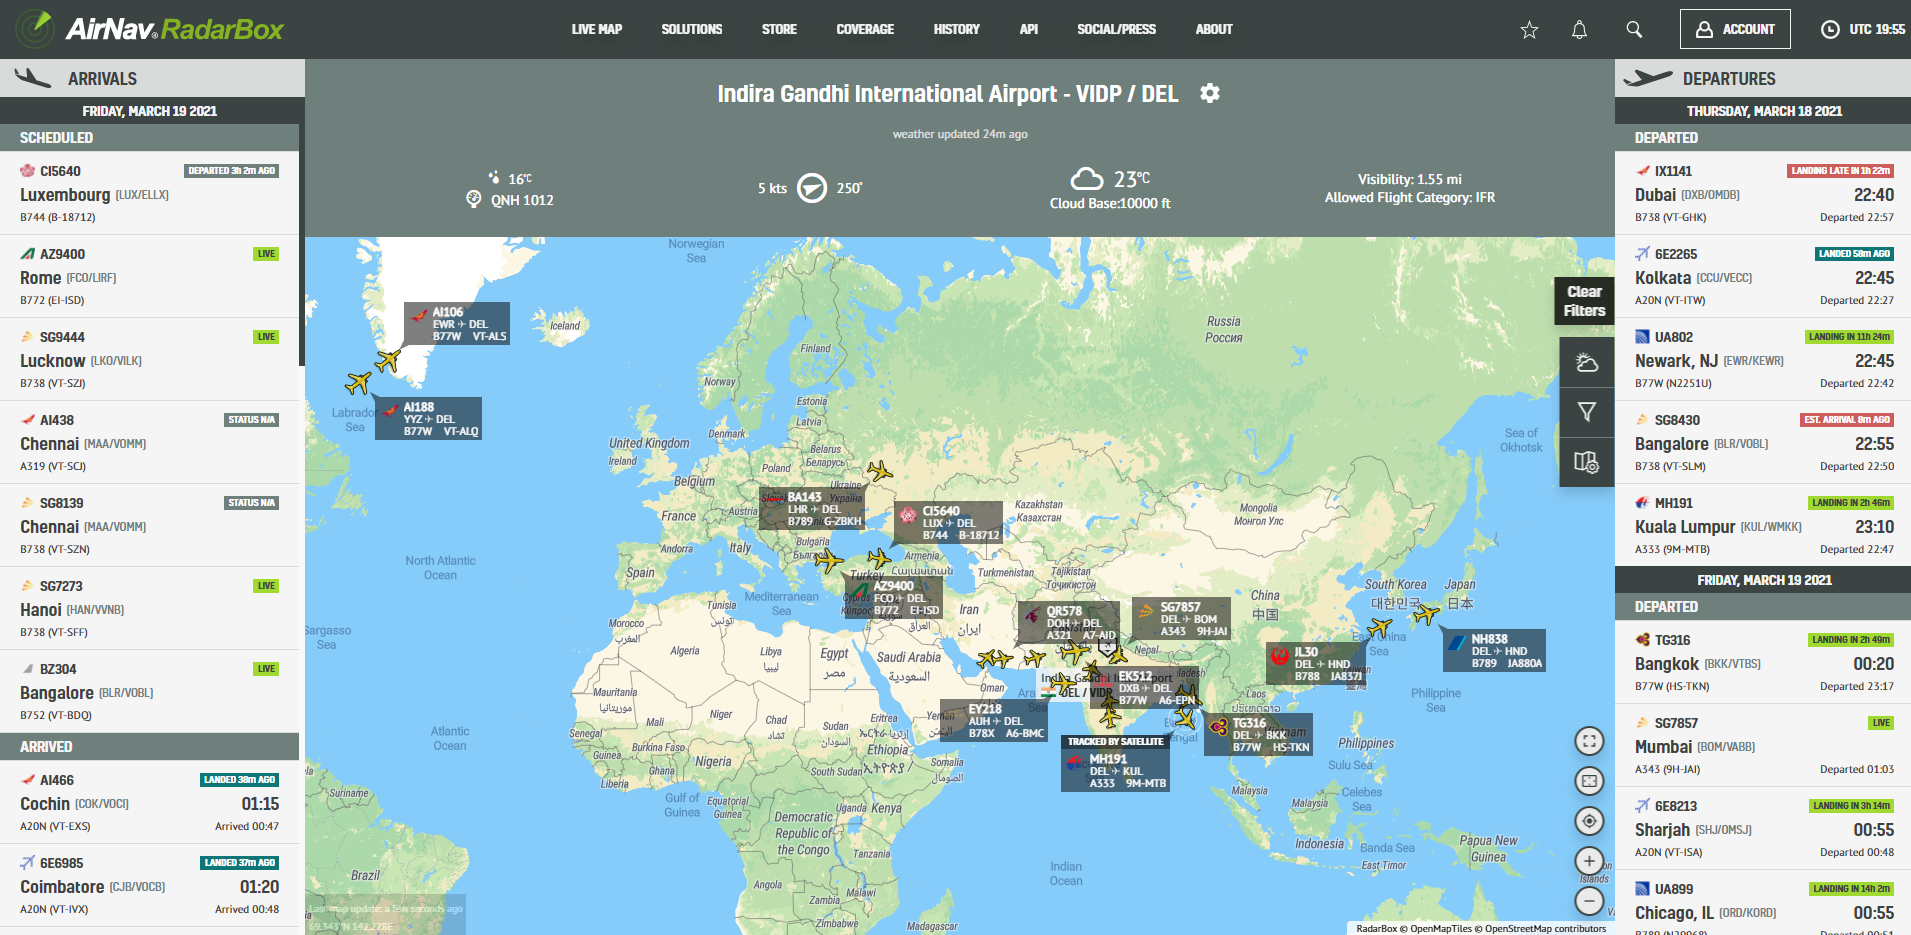
Airport View Tool
The Airport View tool displays the live inbound (arrivals) and outbound flight traffic (departures) of a single airport within a single window. It is an excellent secondary tracking resource for Air Traffic Controllers and plane spotters alike. Airport View also displays the prevailing weather conditions at any given airport.
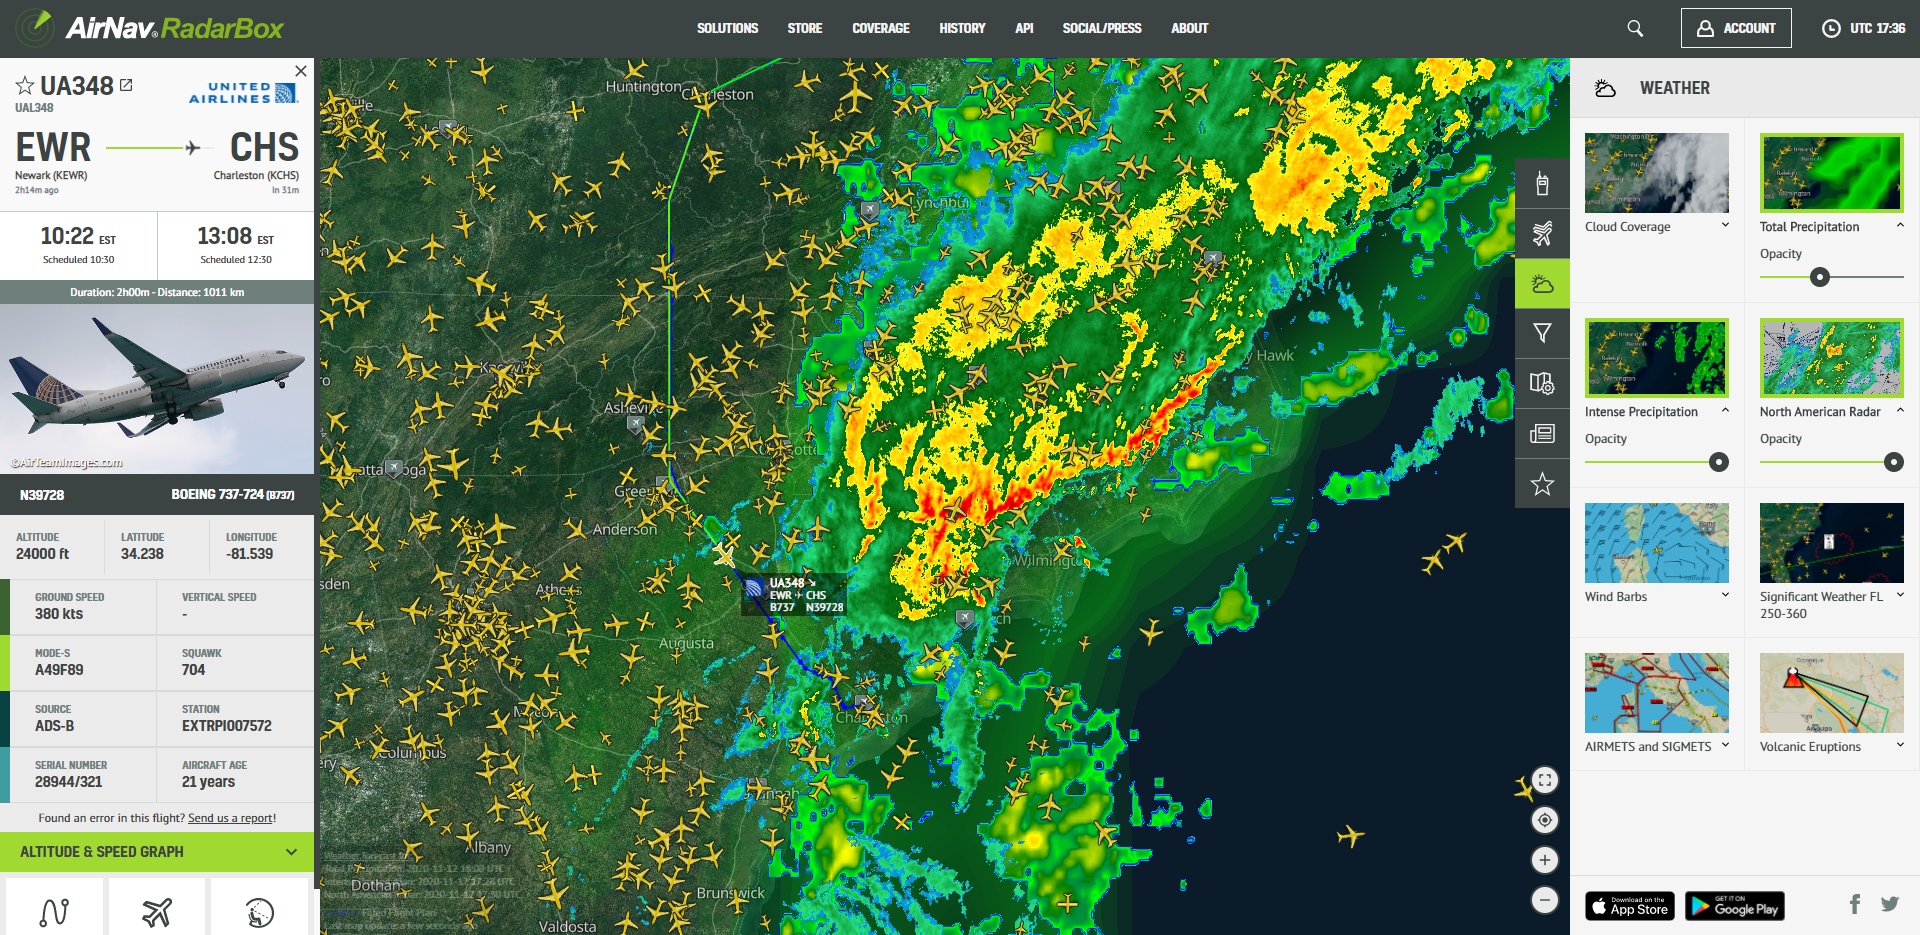
Advanced Weather Layers
The 8 weather layers on Radarbox display different aspects of the weather. The clouds layer displays the location and movement of clouds on the map. The Total Precipitation, Intense Precipitation and North American Radar are excellent references that display rain and precipitation. The Wind Barbs layer overlays the direction and speed of the wind, while the Volcano layer, FL250-360 Weather layer and AIRMETS & SIGMETS all display adverse or significant weather conditions on the map.
Data Sharing
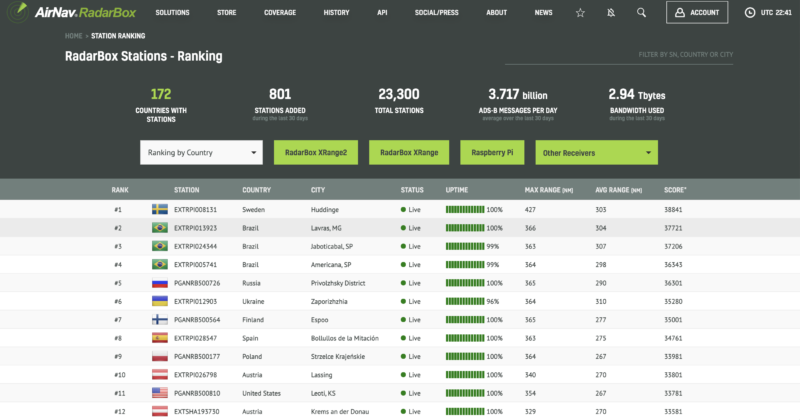
To my surprise there are currently over 24,000 devices all over the world, including some in the most remote places, all sharing data to make flight tracking possible. Data sharers are passionate contributors to make sure there are strong signals available to improve the accuracy of flight tracking. On the AirNav Radabox website there are ranking and statistics of all data sharers.
If you’re from a remote area, in which AirNav does not have coverage, they are happy to send out a complimentary flight tracking kit, including hardware such as a receiver, antenna and other tools.

Special Offer
Currently, a 25% saving offer is available to blog viewers. Use Code SAVE25 and get 25% off on any plan
Subscribe now on Radarbox


Hi!
I’m trying desperately to find the difference between red and green course lines
on AirNav Radar Box.
Can you help me?
Sincerely
Harald
You need to contact AirNav from their site for support.
Amazing information. Hope normal travel can go back to normal soon. I miss travelling so much. Being fully vaccinated or not. Maybe the airlines checking passengers temperature before boarding. Thanks for sharing.