


Airports Council International (ACI) World has published the top 10 busiest airports worldwide for 2021 showing encouraging signs of traffic recovery as many previous busiest airports re-join top ranks.
The world airport rankings are based on the preliminary compilation of 2021 global data from airports around the world.
Passenger traffic
Total global passengers in 2021 is estimated to be close to 4.5 billion, representing an increase of almost 25% from 2020, or a drop of more than 50% from 2019 results.
Passenger traffic at the top 10 busiest airports, representing collectively almost 10% of global traffic (463 million passengers), witnessed a gain of 51.8% from 2020, or a drop of 29.1% vis-à-vis their 2019 results.
Hartsfield-Jackson Atlanta International Airport (ATL, 75.7 million passengers, +76.4%) is back at the top of 2021 rankings, followed by Dallas/Fort Worth International Airport (DFW, 62.5 million passengers, +58.7%), and Denver International Airport (DEN, 58.8 million passengers, +74.4%).
After reaching the top rank in 2020, Guangzhou Bai Yun International Airport (CAN, 40.3 million passengers, -8.0%) slid to the eighth position in 2021.
Eight of the top 10 airports for passenger traffic are in the United States with the two remaining in China. All top 10 airports have a significant share of domestic traffic, the traffic segment that has been leading global recovery.
The biggest improvement recorded was from Orlando International Airport (MCO, 40.4 million passengers, +86.7%) that jumped from 27th position in 2020 to seventh spot in 2021.
“The ACI World passenger traffic rankings tell the story of an encouraging trend of recovery, with most of the recurrent busiest airports pre-COVID-19 back at the top,” ACI World Director General Luis Felipe de Oliveira said. “Although we are cautious that recovery could face multiple headwinds, the momentum created by reopening plans by countries could lead to an uptick in travel in the second half of 2022.
PASSENGERS*
| 2021 | 2020 | 2019 | Airport | 2021 | % vs 2020 | % vs 2019 |
| 1 | 2 | 1 | ATLANTA GA, US (ATL) | 75 704 760 | 76.4 | -31.5 |
| 2 | 4 | 10 | DALLAS/FORT WORTH TX, US (DFW) | 62 465 756 | 58.7 | -16.8 |
| 3 | 8 | 16 | DENVER CO, US (DEN) | 58 828 552 | 74.4 | -14.8 |
| 4 | 13 | 6 | CHICAGO IL, US (ORD) | 54 020 399 | 75.1 | -36.2 |
| 5 | 15 | 3 | LOS ANGELES CA, US (LAX) | 48 007 284 | 66.8 | -45.5 |
| 6 | 18 | 34 | CHARLOTTE NC, US (CLT) | 43 302 230 | 59.2 | -13.4 |
| 7 | 27 | 31 | ORLANDO FL, US (MCO) | 40 351 068 | 86.7 | -20.3 |
| 8 | 1 | 11 | GUANGZHOU, CN (CAN) | 40 259 401 | -8.0 | -45.1 |
| 9 | 3 | 24 | CHENGDU, CN (CTU) | 40 117 496 | -1.5 | -28.2 |
| 10 | 22 | 30 | LAS VEGAS NV, US (LAS) | 39 754 366 | 78.6 | -23.1 |
* Total passengers enplaned and deplaned, passengers in transit counted once
INTERNATIONAL PASSENGERS*
| 2021 | 2020 | 2019 | Airport | 2021 | % vs 2020 | % vs 2019 |
| 1 | 1 | 1 | DUBAI, AE (DXB) | 29 110 609 | 12.7 | -66.3 |
| 2 | 6 | 14 | ISTANBUL, TR (IST) | 26 466 169 | 66.0 | -33.1 |
| 3 | 2 | 3 | AMSTERDAM, NL (AMS) | 25 488 783 | 22.1 | -64.4 |
| 4 | 5 | 8 | FRANKFURT, DE (FRA) | 22 697 490 | 34.8 | -64.0 |
| 5 | 4 | 6 | PARIS, FR (CDG) | 22 616 995 | 18.7 | -67.6 |
| 6 | 7 | 15 | DOHA, QA (DOH) | 17 701 978 | 41.4 | -54.4 |
| 7 | 3 | 2 | LONDON, GB (LHR) | 17 624 931 | -14.7 | -76.8 |
| 8 | 31 | 26 | ANTALYA, TR (AYT) | 17 148 111 | 160.4 | -40.3 |
| 9 | 10 | 11 | MADRID, ES (MAD) | 15 337 775 | 38.8 | -65.9 |
| 10 | 28 | 61 | CANCÚN, MX (CUN) | 13 261 951 | 94.5 | -19.7 |
* International passengers enplaned and deplaned
Cargo and Aircraft Movements
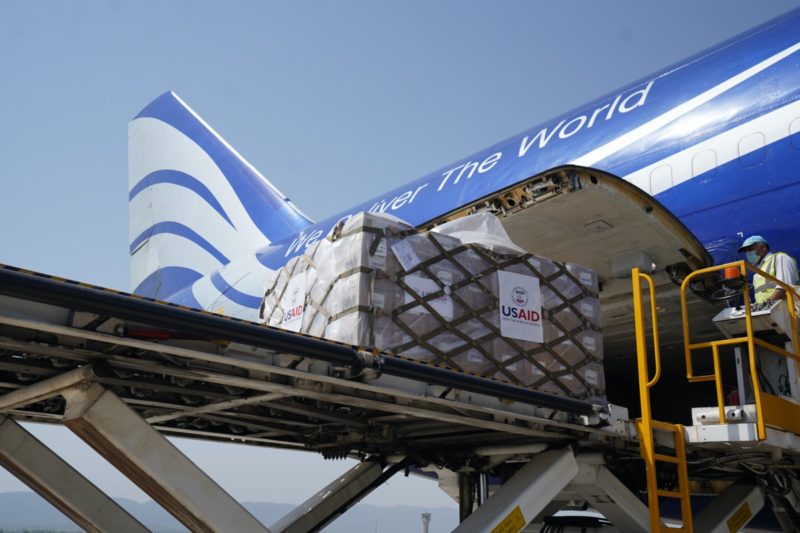
Air cargo, which was less impacted by COVID-19, had its volumes increase by close to 15% year-over-year (+3.5% versus 2019), to an estimated record 124 million metric tonnes in 2021.
Air cargo volumes at the top 10 airports, representing collectively around 25% (34.2 million metric tonnes) of the global volumes in 2021, gained 12.4% in 2021 year-over-year (or 15.0% vs. 2019 results). The gain can be attributed to the continued increase in demand for online consumer goods and pharmaceutical products.
Hong Kong International Airport (HKG, 5.0 million metric tonnes, +12.5%) gained back the top rank and Memphis International Airport (MEM, 4.5 million metric tonnes, -2.9%) went back to second position, followed by Shanghai Pudong International Airport (PVG, 4.0 million metric tonnes, +8.0%) in third.
ACI World estimates that there were over 69 million global aircraft movements in 2021, representing a gain of more than 12% from 2020. The top 10 airports represent close to 8% of global traffic (5.3 million movements) and experienced a gain of 33.9% year-over-year, still representing a drop of 16.1% vis-à-vis 2019.
Hartsfield-Jackson Atlanta International Airport (ATL, 708 thousand movements, +29.1%) leads, followed by Chicago O’Hare International Airport (ORD, 684 thousand, +27.1%) and Dallas/Fort Worth International Airport (DFW, 652 thousand, +26.7%). All top 10 airports for aircraft movements are in the United States.
CARGO (METRIC TONNES)*
| 2021 | 2020 | 2019 | Airport | 2021 | % vs 2020 | % vs 2019 |
| 1 | 2 | 1 | HONG KONG SAR, HK (HKG) | 5 025 495 | 12.5 | 4.5 |
| 2 | 1 | 2 | MEMPHIS TN, US (MEM) | 4 480 465 | -2.9 | 3.6 |
| 3 | 3 | 3 | SHANGHAI, CN (PVG) | 3 982 616 | 8.0 | 9.6 |
| 4 | 4 | 6 | ANCHORAGE AK, US (ANC**) | 3 555 160 | 12.6 | 29.5 |
| 5 | 6 | 5 | INCHEON, KR (ICN) | 3 329 292 | 18.0 | 20.4 |
| 6 | 5 | 4 | LOUISVILLE KY, US (SDF) | 3 052 269 | 4.6 | 9.4 |
| 7 | 7 | 9 | TAIPEI, TW (TPE) | 2 812 065 | 20.0 | 28.9 |
| 8 | 8 | 13 | LOS ANGELES CA, US (LAX) | 2 691 830 | 20.7 | 28.7 |
| 9 | 11 | 10 | TOKYO, JP (NRT) | 2 644 074 | 31.1 | 25.7 |
| 10 | 9 | 8 | DOHA, QA (DOH) | 2 620 095 | 20.5 | 18.2 |
*Cargo: loaded and unloaded freight and mail in metric tonnes
** Includes transit freight
INTERNATIONAL FREIGHT (METRIC TONNES)*
| 2021 | 2020 | 2019 | Airport | 2021 | % vs 2020 | % vs 2019 |
| 1 | 1 | 1 | HONG KONG SAR, HK (HKG) | 4 986 256 | 12.8 | 6.0 |
| 2 | 3 | 3 | INCHEON, KR (ICN) | 3 273 004 | 18.6 | 22.9 |
| 3 | 2 | 2 | SHANGHAI, CN (PVG) | 3 245 548 | 9.9 | 14.9 |
| 4 | 4 | 6 | TAIPEI, TW (TPE) | 2 793 584 | 20.2 | 29.0 |
| 5 | 7 | 7 | TOKYO, JP (NRT) | 2 591 255 | 32.3 | 27.0 |
| 6 | 6 | 5 | DOHA, QA (DOH) | 2 589 283 | 20.7 | 19.1 |
| 7 | 5 | 10 | ANCHORAGE AK, US (ANC**) | 2 438 809 | 9.8 | 25.5 |
| 8 | 8 | 4 | DUBAI, AE (DXB) | 2 319 185 | 20.0 | -7.8 |
| 9 | 9 | 9 | FRANKFURT, DE (FRA) | 2 194 653 | 20.7 | 11.9 |
| 10 | 10 | 12 | MIAMI FL, US (MIA) | 2 040 547 | 17.9 | 19.6 |
*International freight loaded and unloaded in metric tonnes
** Includes transit freight
AIRCRAFT MOVEMENTS*
| 2021 | 2020 | 2019 | Airport | 2021 | % vs 2020 | % vs 2019 |
| 1 | 1 | 2 | ATLANTA GA, US (ATL) | 707 661 | 29.1 | -21.7 |
| 2 | 2 | 1 | CHICAGO IL, US (ORD) | 684 201 | 27.1 | -25.6 |
| 3 | 3 | 3 | DALLAS/FORT WORTH TX, US (DFW) | 651 895 | 26.7 | -9.5 |
| 4 | 4 | 5 | DENVER CO, US (DEN) | 580 866 | 32.9 | -8.1 |
| 5 | 6 | 7 | CHARLOTTE NC, US (CLT) | 519 895 | 30.6 | -10.1 |
| 6 | 7 | 4 | LOS ANGELES CA, US (LAX) | 506 769 | 33.6 | -26.7 |
| 7 | 10 | 8 | LAS VEGAS NV, US (LAS) | 486 540 | 50.4 | -12.0 |
| 8 | 13 | 25 | PHOENIX AZ, US (PHX) | 408 285 | 31.6 | -7.0 |
| 9 | 24 | 30 | MIAMI FL, US (MIA) | 387 973 | 54.4 | -6.9 |
| 10 | 21 | 14 | HOUSTON TX, US (IAH) | 378 562 | 41.4 | -20.8 |
*Movements: landings and take-offs


Is all this top 10 list available in 1985 along with the top10 worst airline/on time %?
Why isn’t mumbai on the list it is the worlds most busiest airport with only one runway operational
Yeah I too thought it would be there, or Delhi IGI/VIDP too.