
The skies aren’t always smooth sailing, due to frequent turbulence on certain challenging routes. Currently, the Santiago (SCL) to Santa Cruz (VVI) route is the most turbulent route, but a significant number of flights worldwide encounter turbulence, as per the turbli database. Notably, flights departing from Tokyo frequently experience significant turbulence on long-haul routes, as reported by Bloomberg.
Turbulence occurs due to several reasons based on the landscape and region. For instance, on the Santiago-Santa Cruz route, the turbulence is primarily caused by the Pacific and Atlantic winds crossing the Andes at right angles.
Other notable regions prone to turbulence include the equator, which is known for strong vertical air currents and frequent thunderstorms. Japan also experiences high turbulence levels due to its mountainous terrain and proximity to the ocean.
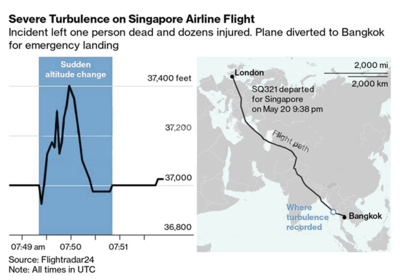
Recently, a Singapore Airlines Boeing 777 en route to Singapore encountered fatal turbulence resulting in a diversion to Bangkok. The aircraft hit severe turbulence, causing one fatality and injuring 30 occupants on board. This has sparked heightened concern around the probability of turbulence and routes or areas where flights are likely to experience it.
Types of Turbulence and Causes Behind
Before we dive into the most turbulent routes, let’s understand what are the types of turbulence and their causes. Broadly, it’s the result of variations in airflow.
1. Clear Air Turbulence (CAT)
- Cause: Often occurs in clear skies near jet streams due to sudden changes in wind speed or direction at high altitudes.
- Routes Affected: Long-haul flights over the Pacific, including routes from Tokyo.
2. Mountain Wave Turbulence
- Cause: Wind flows over mountains, creating waves of air on the downwind side. This is especially prevalent in regions with significant mountain ranges.
- Routes Affected: Flights over the Andes, such as Santiago to Santa Cruz.
3. Thermal Turbulence
- Cause: Surface heating causes rising warm air (thermals) that can lead to turbulent conditions, commonly found over land during the daytime.
- Routes Affected: Equatorial routes where intense solar heating occurs.
4. Mechanical Turbulence
- Cause: Wind flows over or around obstacles like buildings, trees, or rough terrain, causing disruptions in the airflow.
- Routes Affected: Urban areas or routes close to large structures and varying terrains.
5. Convective Turbulence
- Cause: Thunderstorms and convective weather systems cause strong updrafts and downdrafts.
- Routes Affected: Equatorial regions and areas prone to frequent thunderstorms.
Global Top 10 Turbulent Routes
Recent data from Turbli revealed that certain routes around the world are particularly prone to high turbulence levels. These routes exhibit significant turbulence due to a combination of landscape features, climatic conditions, and jet stream positions.
Turbli analyzed a total of 150,000 routes, from which only those routes active as of December 2023 have been ranked. According to Turbli founder Ignacio Gallego Marcos, the routes are ranked based on the eddy dissipation rate (EDR), which is the measure of turbulence intensity at a specific location.
The following table highlights the global routes with the highest average turbulence.
| Rank | Route | Distance (km) | Avg. turbulence (edr) |
|---|---|---|---|
| 1 | Santiago (SCL) - Santa Cruz (VVI) | 1905 | 17.568 |
| 2 | Almaty (ALA) - Bishkek (FRU) | 210 | 17.457 |
| 3 | Lanzhou (LHW) - Chengdu (CTU) | 661 | 16.75 |
| 4 | Centrair (NGO) - Sendai (SDJ) | 517 | 16.579 |
| 5 | Milan (MXP) - Geneva (GVA) | 214 | 16.398 |
| 6 | Lanzhou (LHW) - Xianyang (XIY) | 519 | 16.337 |
| 7 | Osaka (KIX) - Sendai (SDJ) | 655 | 16.307 |
| 8 | Xianyang (XIY) - Chengdu (CTU) | 624 | 16.25 |
| 9 | Xianyang (XIY) - Chongqing (CKG) | 561 | 16.041 |
| 10 | Milan (MXP) - Zurich (ZRH) | 203 | 16.016 |
Top 10 Turbulent Routes in North America
North America has its own set of routes where turbulence is a frequent challenge. The combination of the Rocky Mountains, weather systems, and jet stream activities contribute to turbulence on this continent.
The U.S. East Coast, particularly routes involving New York and Raleigh/Durham, sees considerable turbulence due to the frequent weather systems and the Appalachian Mountains.
| Rank | Route | Distance (km) | Avg. turbulence (edr) |
|---|---|---|---|
| 1 | Nashville (BNA) - Raleigh/Durham (RDU) | 711 | 14.728 |
| 2 | Charlotte (CLT) - Pittsburgh (PIT) | 589 | 14.582 |
| 3 | Denver (DEN) - Puerto Vallarta (PVR) | 2127 | 14.535 |
| 4 | New York (JFK) - Raleigh/Durham (RDU) | 686 | 14.517 |
| 5 | Warwick (PVD) - Syracuse (SYR) | 414 | 14.494 |
| 6 | Atlanta (ATL) - Dulles (IAD) | 859 | 14.492 |
| 7 | Pittsburgh (PIT) - Raleigh/Durham (RDU) | 527 | 14.478 |
| 8 | New York (LGA) - Portland (PWM) | 433 | 14.457 |
| 9 | Boston (BOS) - Syracuse (SYR) | 425 | 14.453 |
| 10 | Boston (BOS) - Philadelphia (PHL) | 450 | 14.453 |
Top 10 Turbulent Routes in South America
In South America, turbulent routes are often influenced by the Andes and coastal winds.
Besides the Santiago to Santa Cruz route, other routes also experience high turbulence levels as shown in the table below, with Santiago (SCL) emerging as a central hub for turbulent routes.
| Rank | Route | Distance (km) | Avg. turbulence (edr) |
|---|---|---|---|
| 1 | Santiago (SCL) - Santa Cruz (VVI) | 1905 | 17.568 |
| 2 | Florianópolis (FLN) - Santiago (SCL) | 2220 | 15.307 |
| 3 | Florianópolis (FLN) - Ciudad de la Costa (MVD) | 1066 | 15.224 |
| 4 | Santiago (SCL) - Asunción (ASU) | 1571 | 15.162 |
| 5 | Buenos Aires (EZE) - Santiago (SCL) | 1140 | 15.124 |
| 6 | Buenos Aires (EZE) - Florianópolis (FLN) | 1236 | 15.076 |
| 7 | Santiago (SCL) - Ciudad de la Costa (MVD) | 1369 | 14.993 |
| 8 | São Paulo (GRU) - Santiago (SCL) | 2617 | 14.892 |
| 9 | São Paulo (GRU) - Ciudad de la Costa (MVD) | 1567 | 14.85 |
| 10 | Rio De Janeiro (GIG) - Santiago (SCL) | 2937 | 14.791 |
Top 10 Turbulent Routes in Europe
In Europe, turbulence is often influenced by the Alps and varying weather patterns. Zurich (ZRH) appears frequently in the list, indicating its exposure to turbulent conditions, influenced by the surrounding Alps.
| Rank | Route | Distance (km) | Avg. turbulence (edr) |
|---|---|---|---|
| 1 | Milan (MXP) - Geneva (GVA) | 214 | 16.398 |
| 2 | Milan (MXP) - Zurich (ZRH) | 203 | 16.016 |
| 3 | Geneva (GVA) - Zurich (ZRH) | 230 | 14.964 |
| 4 | Marseille (MRS) - Zurich (ZRH) | 517 | 13.987 |
| 5 | Zgornji Brnik (LJU) - Zurich (ZRH) | 471 | 13.878 |
| 6 | Nice (NCE) - Basel (BSL) | 438 | 13.876 |
| 7 | Nice (NCE) - Zurich (ZRH) | 434 | 13.76 |
| 8 | Yerevan (EVN) - Tbilisi (TBS) | 175 | 13.758 |
| 9 | Basel (BSL) - Venezia (VCE) | 437 | 13.713 |
| 10 | Frankfurt am Main (FRA) - Caselle Torinese (TRN) | 541 | 13.653 |
Top 10 Turbulent Routes in Asia
Asia’s turbulent routes are influenced by mountainous regions and monsoon systems. Xianyang (XIY) appears frequently, highlighting the impact of China’s complex terrain on turbulence levels.
| Rank | Route | Distance (km) | Avg. turbulence (edr) |
|---|---|---|---|
| 1 | Almaty (ALA) - Bishkek (FRU) | 210 | 17.457 |
| 2 | Lanzhou (LHW) - Chengdu (CTU) | 661 | 16.75 |
| 3 | Centrair (NGO) - Sendai (SDJ) | 517 | 16.579 |
| 4 | Lanzhou (LHW) - Xianyang (XIY) | 519 | 16.337 |
| 5 | Osaka (KIX) - Sendai (SDJ) | 655 | 16.307 |
| 6 | Xianyang (XIY) - Chengdu (CTU) | 624 | 16.25 |
| 7 | Xianyang (XIY) - Chongqing (CKG) | 561 | 16.041 |
| 8 | Wuhan (WUH) - Xianyang (XIY) | 654 | 16.008 |
| 9 | Osaka (KIX) - Fukuoka (FUK) | 452 | 15.974 |
| 10 | Tokyo (NRT) - Osaka (ITM) | 463 | 15.955 |
Top 10 Turbulent Routes in Oceania
In Oceania, tropical weather systems and oceanic wind interactions contribute to turbulence.
Australia’s major airports like Sydney (SYD), and Brisbane (BNE) frequently appear in the Top 10 turbulence-prone routes, indicating high turbulence levels in the area.
| Rank | Route | Distance (km) | Avg. turbulence (edr) |
|---|---|---|---|
| 1 | Brisbane (BNE) - Sydney (SYD) | 750 | 15.31 |
| 2 | Port Vila (VLI) - Auckland (AKL) | 2232 | 14.039 |
| 3 | Melbourne (MEL) - Sydney (SYD) | 705 | 14.009 |
| 4 | Port Vila (VLI) - Brisbane (BNE) | 1893 | 13.874 |
| 5 | Port Vila (VLI) - Sydney (SYD) | 2481 | 13.874 |
| 6 | Port Vila (VLI) - Melbourne (MEL) | 3185 | 13.86 |
| 7 | Brisbane (BNE) - Melbourne (MEL) | 1379 | 13.784 |
| 8 | Brisbane (BNE) - Adelaide (ADL) | 1621 | 13.586 |
| 9 | Brisbane (BNE) - Darwin (DRW) | 2848 | 13.56 |
| 10 | Auckland (AKL) - Christchurch (CHC) | 744 | 13.457 |
Most Turbulent Routes in Africa
In Africa, wind patterns and geographic features like mountain ranges affect turbulence levels. Routes originating from Cape Town (CPT) are often exposed to turbulent conditions due to surrounding geographic features.
| Rank | Route | Distance (km) | Avg. turbulence (edr) |
|---|---|---|---|
| 1 | Cape Town (CPT) - Durban (DUR) | 1278 | 14.894 |
| 2 | Cape Town (CPT) - Mpaka (SHO) | 1516 | 14.633 |
| 3 | Cape Town (CPT) - Maputo (MPM) | 1614 | 14.582 |
| 4 | Cape Town (CPT) - Johannesburg (JNB) | 1270 | 14.203 |
| 5 | Durban (DUR) - Johannesburg (JNB) | 478 | 14.034 |
Conclusion
Turbulence is a multifaceted phenomenon influenced by several factors including geographic features, weather patterns, and atmospheric conditions. Understanding the specific causes and types of turbulence can help in better managing and preparing for a safe flight.
The routes highlighted in this article provide insights into regions where flights are likely to encounter significant turbulence, necessitating caution, and preparedness.
Featured Image: Dennis Sylvester Hurd via Wikimedia Commons