


Here are the latest data on the most delayed airlines and airports around the world in July 2022.
Which Airport and Airline have the highest numbers of delays in July 2022? The data are breakdown by region. Data Source: RadarBox
Video
Europe
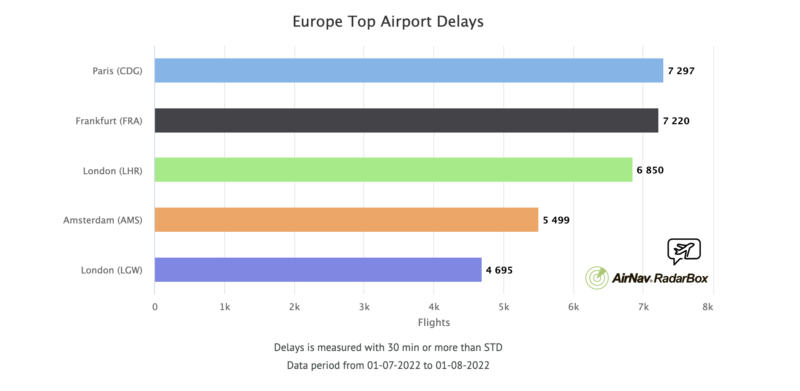
Major European Airports such as Paris, Frankfurt, London Heathrow, Amsterdam and London Gatwick have the most delays in numbers in July.
| Rank | Airport | No. of Flights Delayed | Percentage of all flights |
| #1 |  Paris (CDG) Paris (CDG) | 7297 | 34.79% |
| #2 |  Frankfurt (FRA) Frankfurt (FRA) | 7220 | 36.65% |
| #3 |  London (LHR) London (LHR) | 6850 | 35.65% |
| #4 |  Amsterdam (AMS) Amsterdam (AMS) | 5499 | 25.49% |
| #5 | London (LGW) | 4695 | 33.51% |
Ryanair has the most delayed number of flights with 30,812 (33.22%) runs late more than 30 minutes, follow by easyJet and Turkish Airlines.

| #1 |  Ryanair (FR / RYR) Ryanair (FR / RYR) | 30812 | 33.22% |
| #2 |  easyJet Airline (U2 / EZY) easyJet Airline (U2 / EZY) | 12088 | 32.25% |
| #3 |  Turkish Airlines (TK / THY) Turkish Airlines (TK / THY) | 11841 | 25.85% |
| #4 |  Lufthansa (LH / DLH) Lufthansa (LH / DLH) | 10678 | 29.38% |
| #5 |  Air France (AF / AFR) Air France (AF / AFR) | 7235 | 30.42% |
Scandinavian Airlines System (SAS) had the highest number of flight cancellations in Europe recently after its pilots went on a strike. The troubled airline has filed for Chapter 11 bankruptcy protection in the United States.
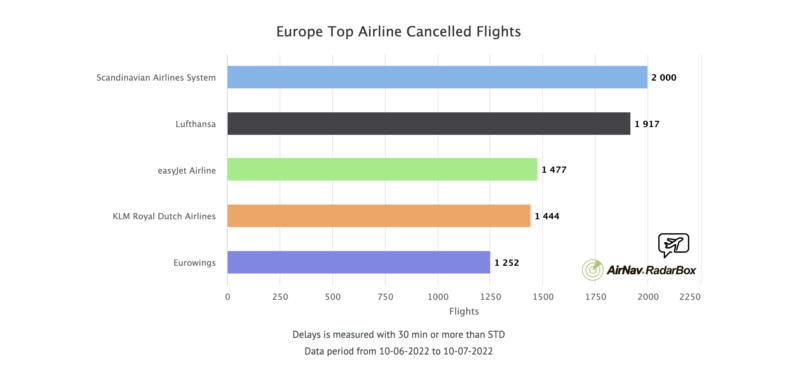
| #1 |  Scandinavian Airlines System (SK / SAS) Scandinavian Airlines System (SK / SAS) | 3561 | 20.47% |
| #2 | Lufthansa (LH / DLH) | 2037 | 5.61% |
| #3 |  KLM Royal Dutch Airlines (KL / KLM) KLM Royal Dutch Airlines (KL / KLM) | 879 | 4.76% |
| #4 |  British Airways (BA / BAW) British Airways (BA / BAW) | 772 | 3.61% |
| #5 |  Eurowings (EW / EWG) Eurowings (EW / EWG) | 766 | 4.78% |
The cancellation data in the chart below shows only last-minute cancellations and does not account for cancellations ahead of time.
North America
Toronto Pearson International Airport saw the most flight delays in North America (41% of the flights are late), followed by Atlanta and Chicago O’Hare, wrapping up the top three airports with the most delays in North America.
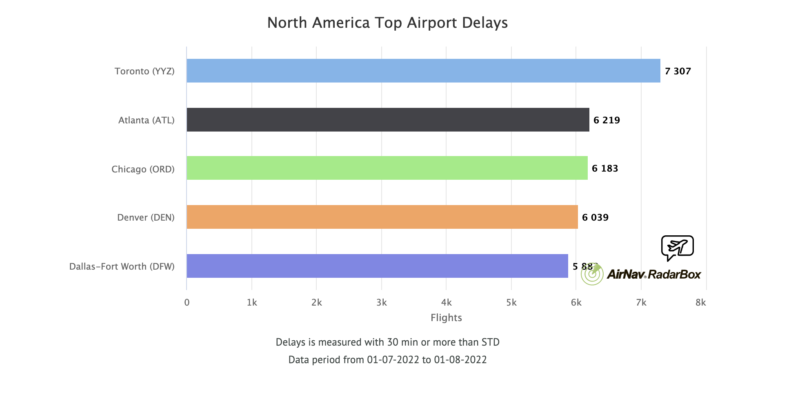
| #1 |  Toronto (YYZ) Toronto (YYZ) | 7307 | 41.09% |
| #2 |  Atlanta (ATL) Atlanta (ATL) | 6219 | 18.77% |
| #3 | Chicago (ORD) | 6183 | 18.26% |
| #4 | Denver (DEN) | 6039 | 20.83% |
| #5 | Dallas-Fort Worth (DFW) | 5883 | 18.75% |
Although American Airlines and Southwest Airlines have more delays. Air Canada has the highest percentage of flight delay at 43%.
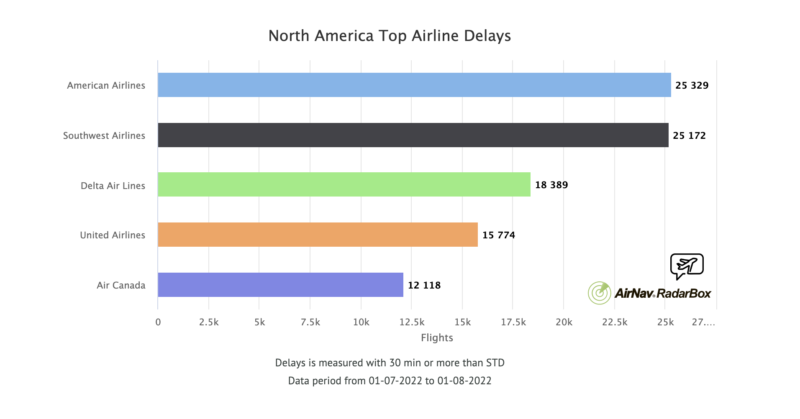
| #1 |  American Airlines (AA / AAL) American Airlines (AA / AAL) | 25329 | 17.05% |
| #2 |  Southwest Airlines (WN / SWA) Southwest Airlines (WN / SWA) | 25172 | 20.36% |
| #3 |  Delta Air Lines (DL / DAL) Delta Air Lines (DL / DAL) | 18389 | 13.24% |
| #4 |  United Airlines (UA / UAL) United Airlines (UA / UAL) | 15774 | 14.89% |
| #5 |  Air Canada (AC / ACA) Air Canada (AC / ACA) | 12118 | 43.11% |
DOT Purposed Stricter Rules
The Department of Transportation (DOT) on Wednesday proposed stricter rules on when airlines would have to compensate passengers for canceled or delayed flights, a move that follows a surge in traveler complaints.
DOT is now proposing to define that as a departure or arrival time that’s off by at least three hours for domestic flights, or at least six hours for international flights. Travelers would also be entitled to a refund if the routing changes or if a connection is added, as well as if a change in aircraft causes a “significant downgrade” in amenities or other features.
Complaints about airline refunds accounted for 87% of the 102,560 complaints the DOT logged in 2020 and about 60% of the 49,958 complaints in 2021.
The DOT’s proposed rules are open to public comment for 90 days.
Asia Pacific
Manila tops the list of airport delays in Asia Pacific airports with 29.55% of flights to/from Manila being late.
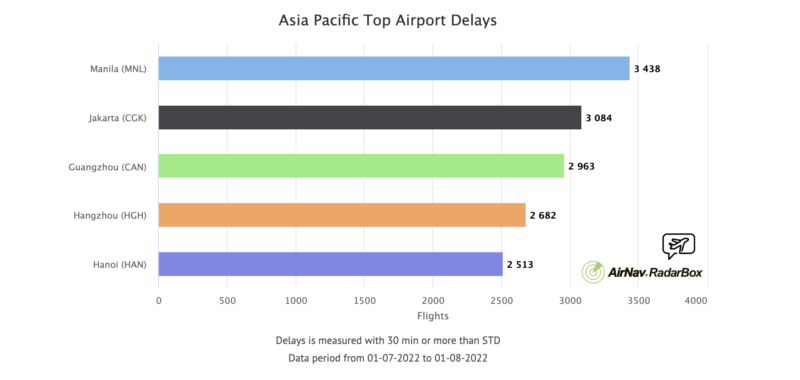
| #1 |  Manila (MNL) Manila (MNL) | 3438 | 29.55% |
| #2 |  Jakarta (CGK) Jakarta (CGK) | 3084 | 16.3% |
| #3 |  Guangzhou (CAN) Guangzhou (CAN) | 2963 | 15.34% |
| #4 | Hangzhou (HGH) | 2682 | 18.53% |
| #5 |  Hanoi (HAN) Hanoi (HAN) | 2513 | 24.52% |
Looking at the list of most affected airlines, China Southern Airlines – based at Guangzhou Baiyun Airport accounted for the most delayed flights in the Asia Pacific region, followed by China Eastern Airlines and India’s low-cost carrier IndiGo. China’s Beijing Airlines and Vietnam’s Vietjet made it to the top five airlines in delays in the Asia Pacific region respectively.
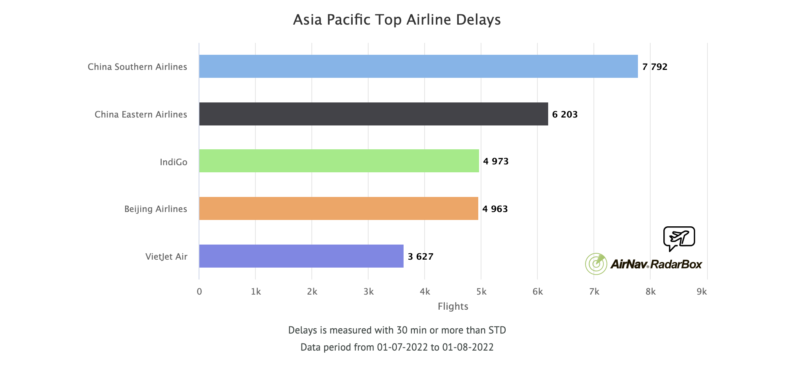
| #1 |  China Southern Airlines (CZ / CSN) China Southern Airlines (CZ / CSN) | 7792 | 12.92% |
| #2 |  China Eastern Airlines (MU / CES) China Eastern Airlines (MU / CES) | 6203 | 10.21% |
| #3 |  IndiGo (6E / IGO) IndiGo (6E / IGO) | 4973 | 10.24% |
| #4 |  Beijing Airlines (CA / BJN) Beijing Airlines (CA / BJN) | 4963 | 13.04% |
| #5 |  VietJet Air (VJ / VJC) VietJet Air (VJ / VJC) | 3627 | 24.36% |
Middle East
Moving towards the Middle East, Dubai International Airport topped the list with the most flight delays last month with 4,143 flights arriving or departing more than 30 minutes behind schedule. Israel’s Ben Gurion International Airport and Qatar’s Hamad International Airport are second and third.
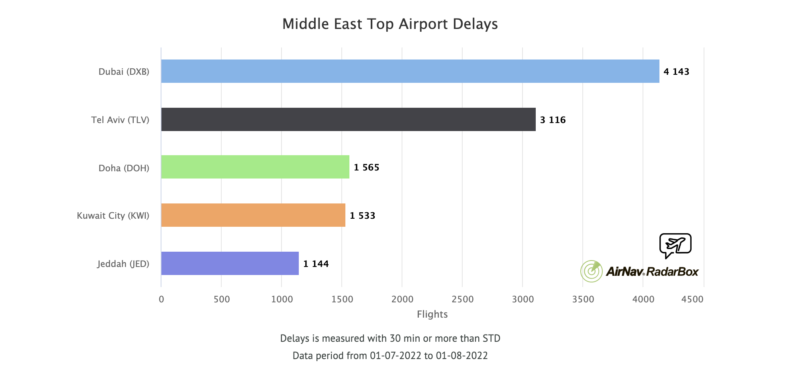
| #1 |  Dubai (DXB) Dubai (DXB) | 4143 | 24.79% |
| #2 |  Tel Aviv (TLV) Tel Aviv (TLV) | 3116 | 40.16% |
| #3 |  Doha (DOH) Doha (DOH) | 1565 | 15.77% |
| #4 |  Kuwait City (KWI) Kuwait City (KWI) | 1533 | 28.74% |
| #5 |  Jeddah (JED) Jeddah (JED) | 1144 | 10.78% |
flydubai and Qatar Airways accounted for the most flight delays in the Middle East.
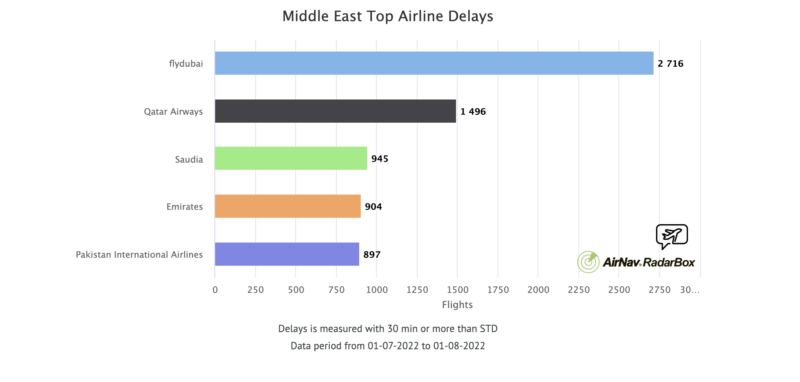
| #1 |  flydubai (FZ / FDB) flydubai (FZ / FDB) | 2716 | 41.76% |
| #2 |  Qatar Airways (QR / QTR) Qatar Airways (QR / QTR) | 1496 | 15.25% |
| #3 |  Saudia (SV / SVA) Saudia (SV / SVA) | 945 | 6.41% |
| #4 |  Emirates (EK / UAE) Emirates (EK / UAE) | 904 | 11.79% |
| #5 |  Pakistan International Airlines (PK / PIA) Pakistan International Airlines (PK / PIA) | 897 | 34.17% |
Latin America
Two of Mexico’s largest airports saw the most number of flight delays, with Benito Juárez International Airport topping the list with 2,534 flight delays.
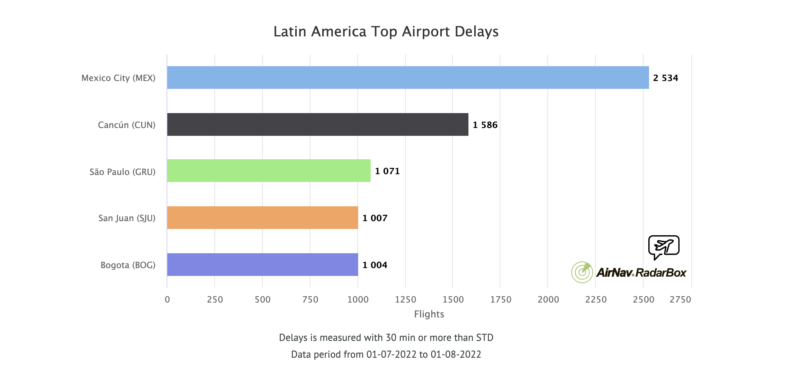
| #1 |  Mexico City (MEX) Mexico City (MEX) | 2534 | 13.69% |
| #2 | Cancún (CUN) | 1586 | 15.99% |
| #3 |  São Paulo (GRU) São Paulo (GRU) | 1071 | 9.47% |
| #4 |  San Juan (SJU) San Juan (SJU) | 1007 | 15.62% |
| #5 |  Bogota (BOG) Bogota (BOG) | 1004 | 7.05% |
Compared to other airlines, Volaris and vivaAerobus which mainly operate out of Benito Juárez International Airport had the most flight delays.
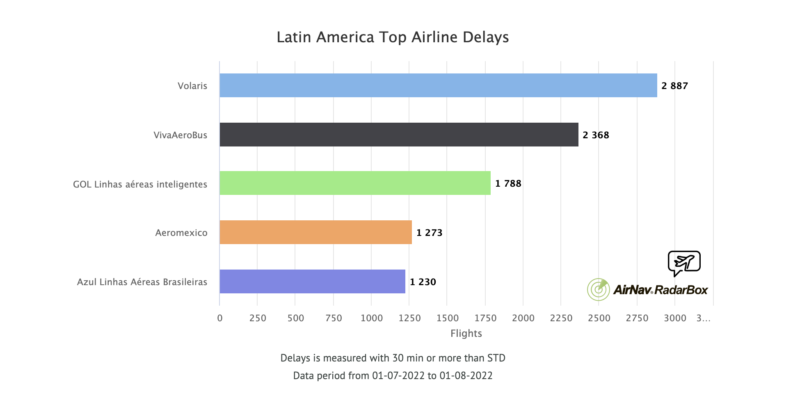
| #1 |  Volaris (Y4 / VOI) Volaris (Y4 / VOI) | 2887 | 17.3% |
| #2 |  VivaAeroBus (VB / VIV) VivaAeroBus (VB / VIV) | 2368 | 21.19% |
| #3 |  GOL Linhas aéreas inteligentes (G3 / GLO) GOL Linhas aéreas inteligentes (G3 / GLO) | 1788 | 9.42% |
| #4 |  Aeromexico (AM / AMX) Aeromexico (AM / AMX) | 1273 | 9.46% |
| #5 |  Azul Linhas Aéreas Brasileiras (AD / AZU) Azul Linhas Aéreas Brasileiras (AD / AZU) | 1230 | 4.48% |
Africa
Cairo International Airport had the highest number of delayed flights in the last month while over 30% of flights to and from Algiers and Tunis were late.
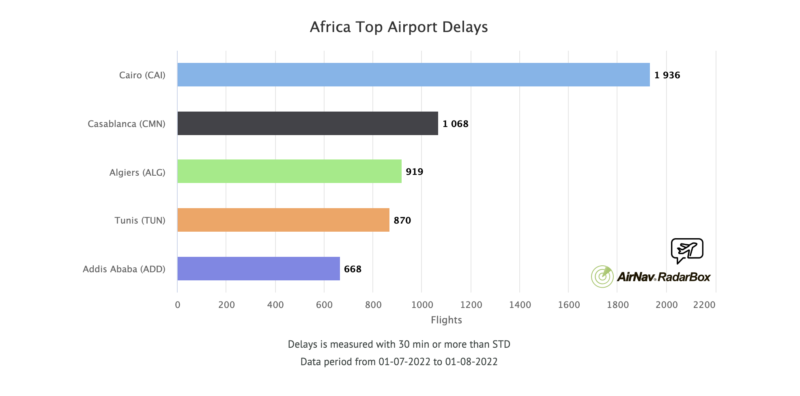
| #1 |  Cairo (CAI) Cairo (CAI) | 1936 | 25.09% |
| #2 |  Casablanca (CMN) Casablanca (CMN) | 1068 | 25.4% |
| #3 |  Algiers (ALG) Algiers (ALG) | 919 | 31.56% |
| #4 |  Tunis (TUN) Tunis (TUN) | 870 | 30.33% |
| #5 |  Addis Ababa (ADD) Addis Ababa (ADD) | 668 | 12.72% |
Egyptair has the highest number of delayed flights, followed by Ethiopian Airlines. 37% of Tunis Air runs late.
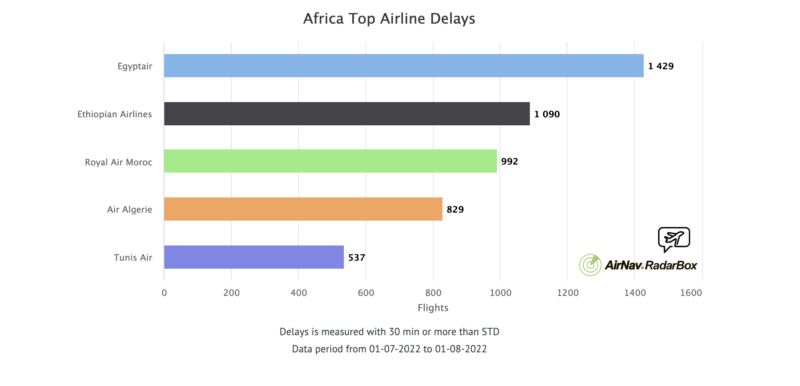
| #1 |  Egyptair (MS / MSR) Egyptair (MS / MSR) | 1429 | 27.96% |
| #2 |  Ethiopian Airlines (ET / ETH) Ethiopian Airlines (ET / ETH) | 1090 | 11.1% |
| #3 |  Royal Air Moroc (AT / RAM) Royal Air Moroc (AT / RAM) | 992 | 20.87% |
| #4 |  Air Algerie (AH / DAH) Air Algerie (AH / DAH) | 829 | 20.39% |
| #5 |  Tunis Air (TU / TAR) Tunis Air (TU / TAR) | 537 | 37.68% |
Here are some useful tips on how to travel these days in case you face travel disruption:
Know Your Rights
The Montreal Convention is the oldest treaty created to protect passengers’ rights and it applies to most international flights. In case of a physical injury resulting from a flight accident, for example, airlines are liable for up to EUR 140,000 (to cover medical expenses). Passengers are eligible for up to EUR 1,400 for damages suffered as a result of lost or destroyed luggage.
In the U.S., if you get bumped from your flight, you are entitled to US flight compensation at least equal to 200% of your one-way fare.
The European Regulation EC261 rule is an extensive bit of legislation that requires airlines to compensate passengers in the event of:
- Denied boarding
- Flight cancellation
- Long delay of flights (three or more hours)
Under EC261 you may be eligible for compensation reaching up to EUR 600 if your flight is delayed by more than 3 hours or gets canceled. AirHelp helps air passengers around the world secure compensation for delayed, canceled, or overbooked flights.

How to File a Claim?
AirHelp can help you if you have a flight disruption within the EU (on any airline), leaving the EU (on any airline) or arriving into EU (on EU airline).
AirHelp can help you to determine whether you’re eligible for compensation and claims through the easy 1-2-3 steps on their website.
Video
Data Source: RadarBox


Super interesting, but would have been much better if done on a % rather than an absolute basis. For example, I’d much rather avoid Air Canada than United despite the former having fewer delayed flights total.